Note
Go to the end to download the full example code.
3. Figure elements
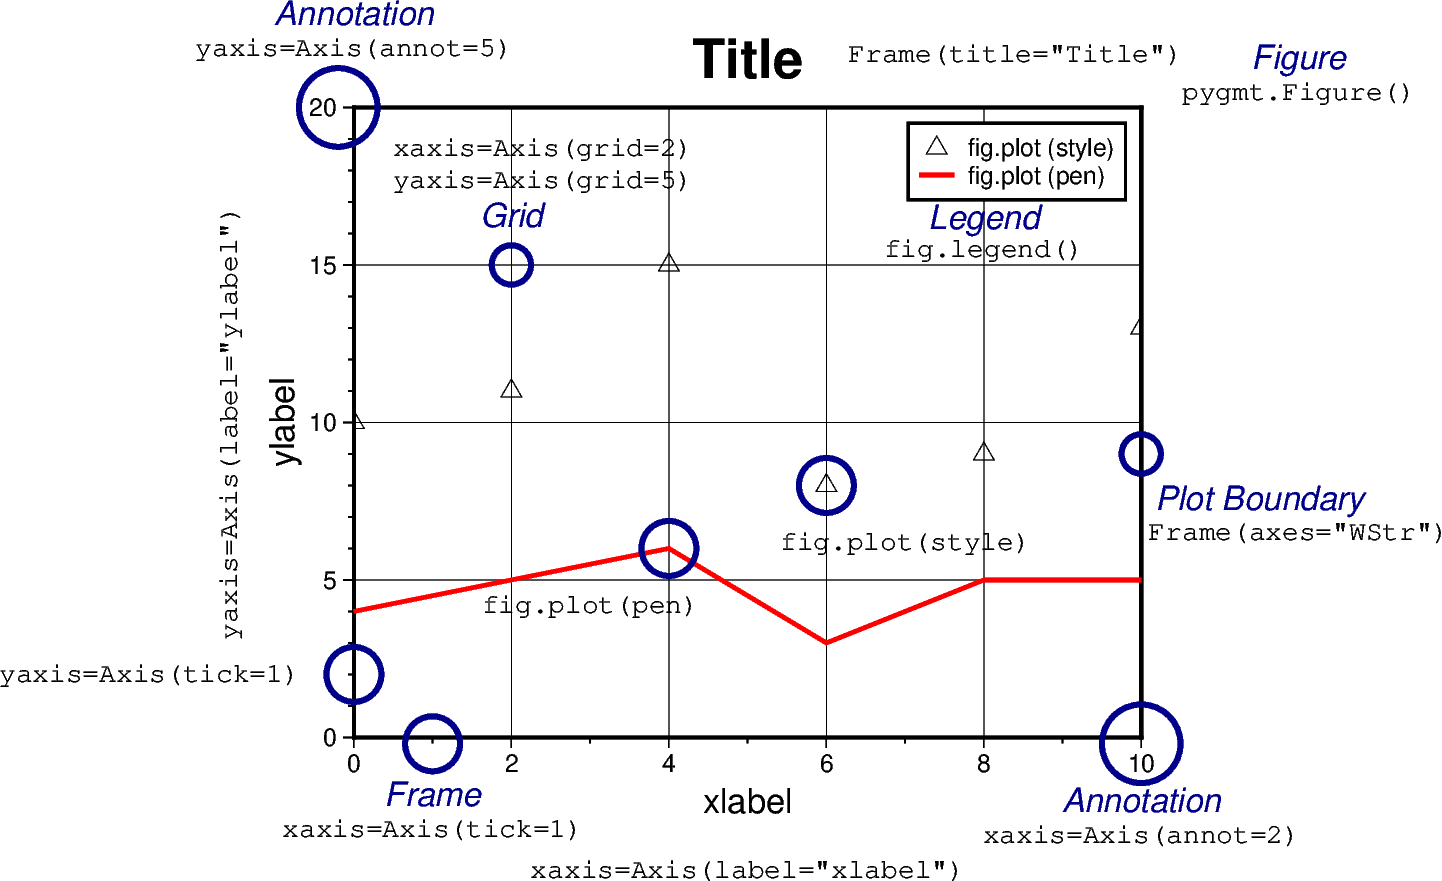
The figure below shows the naming of figure elements in PyGMT.
pygmt.Figure: having a number of plotting methods. Every new figure must start with the creation of apygmt.Figureinstanceframe: setting plot boundaries and the title withpygmt.params.Frame, and adding annotations, ticks, gridlines, and axis labels to each axis withpygmt.params.Axis, e.g., inpygmt.Figure.basemap. Detailed examples can be found at frame and axes attributespygmt.Figure.plot: plotting lines or symbols based on the parameterspenorstyle, respectivelypygmt.Figure.text: plotting text strings whereby thefontparameter adjusts fontsize, fontstyle, and colorpygmt.Figure.legend: showing the meaning of lines or symbols while thelabelis given inpygmt.Figure.plotpygmt.Figure.show: previewing the content added to the current figure instance
import pygmt
from pygmt.params import Axis, Frame

fig = pygmt.Figure()

x = range(0, 11, 2)
y_1 = [10, 11, 15, 8, 9, 13]
y_2 = [4, 5, 6, 3, 5, 5]

fig.basemap(
    region=[0, 10, 0, 20],
    projection="X10c/8c",
    frame=Frame(
        axes="WStr",
        title="Title",
        xaxis=Axis(annot=2, tick=1, grid=2, label="xlabel"),
        yaxis=Axis(annot=5, tick=1, grid=5, label="ylabel"),
    ),
)
fig.plot(x=x, y=y_1, style="t0.3c", label="fig.plot (style)")
fig.plot(x=x, y=y_2, pen="1.5p,red", label="fig.plot (pen)")

mainexplain = {"font": "12p,2,darkblue", "justify": "TC", "no_clip": True}
minorexplain = {"font": "10p,8", "justify": "TC", "no_clip": True}
# ============ Figure
fig.text(x=12, y=22, text="Figure", **mainexplain)
fig.text(x=12, y=20.8, text="pygmt.Figure()", **minorexplain)
# ============ Title
fig.text(x=8.4, y=22, text='Frame(title="Title")', **minorexplain)
# ============ xlabel
fig.text(x=5, y=-3.9, text='xaxis=Axis(label="xlabel")', **minorexplain)
# ============ ylabel
fig.text(x=-1.7, y=10, text='yaxis=Axis(label="ylabel")', angle=90, **minorexplain)
# ============ x-majorticks
fig.plot(x=10, y=-0.2, style="c1c", pen="2p,darkblue", no_clip=True)
fig.text(x=10, y=-1.6, text="Annotation", **mainexplain)
fig.text(x=10, y=-2.8, text="xaxis=Axis(annot=2)", **minorexplain)
# ============ y-majorticks
fig.plot(x=-0.2, y=20, style="c1c", pen="2p,darkblue", no_clip=True)
fig.text(x=0, y=23.4, text="Annotation", **mainexplain)
fig.text(x=0, y=22.2, text="yaxis=Axis(annot=5)", **minorexplain)
# ============ x-minorticks
fig.plot(x=1, y=-0.2, style="c0.7c", pen="2p,darkblue", no_clip=True)
fig.text(x=1, y=-1.4, text="Frame", **mainexplain)
fig.text(x=1, y=-2.6, text="xaxis=Axis(tick=1)", **minorexplain)
# ============ y-minorticks
fig.plot(x=0, y=2, style="c0.7c", pen="2p,darkblue", no_clip=True)
fig.text(x=-2.6, y=2.3, text="yaxis=Axis(tick=1)", **minorexplain)
# ============ Grid
fig.plot(x=2, y=15, style="c0.5c", pen="2p,darkblue")
fig.text(x=2, y=17, text="Grid", **mainexplain)
fig.text(x=2.4, y=19, text="xaxis=Axis(grid=2)", **minorexplain)
fig.text(x=2.4, y=18, text="yaxis=Axis(grid=5)", **minorexplain)
# ============ Plot Boundaries
fig.plot(x=10, y=9, style="c0.5c", pen="2p,darkblue", no_clip=True)
fig.text(x=11.5, y=8, text="Plot Boundary", **mainexplain)
fig.text(x=12, y=6.8, text='Frame(axes="WStr")', **minorexplain)
# ============ fig.plot (style)
fig.plot(x=6, y=8, style="c0.7c", pen="2p,darkblue")
fig.text(x=7, y=6.5, text="fig.plot(style)", **minorexplain)
# ============ fig.plot (pen)
fig.plot(x=4, y=6, style="c0.7c", pen="2p,darkblue")
fig.text(x=3, y=4.5, text="fig.plot(pen)", **minorexplain)
# ============ Legend
fig.legend()
fig.text(x=8, y=16.9, text="Legend", **mainexplain)
fig.text(x=8, y=15.8, text="fig.legend()", **minorexplain)

fig.show()
Total running time of the script: (0 minutes 0.243 seconds)